Creating Reusable Maps and Charts (Snippets)
Snippets are reusable components for maps and charts. You must first create these before you can add them to a dashboard page.
How to Create a Map Snippet
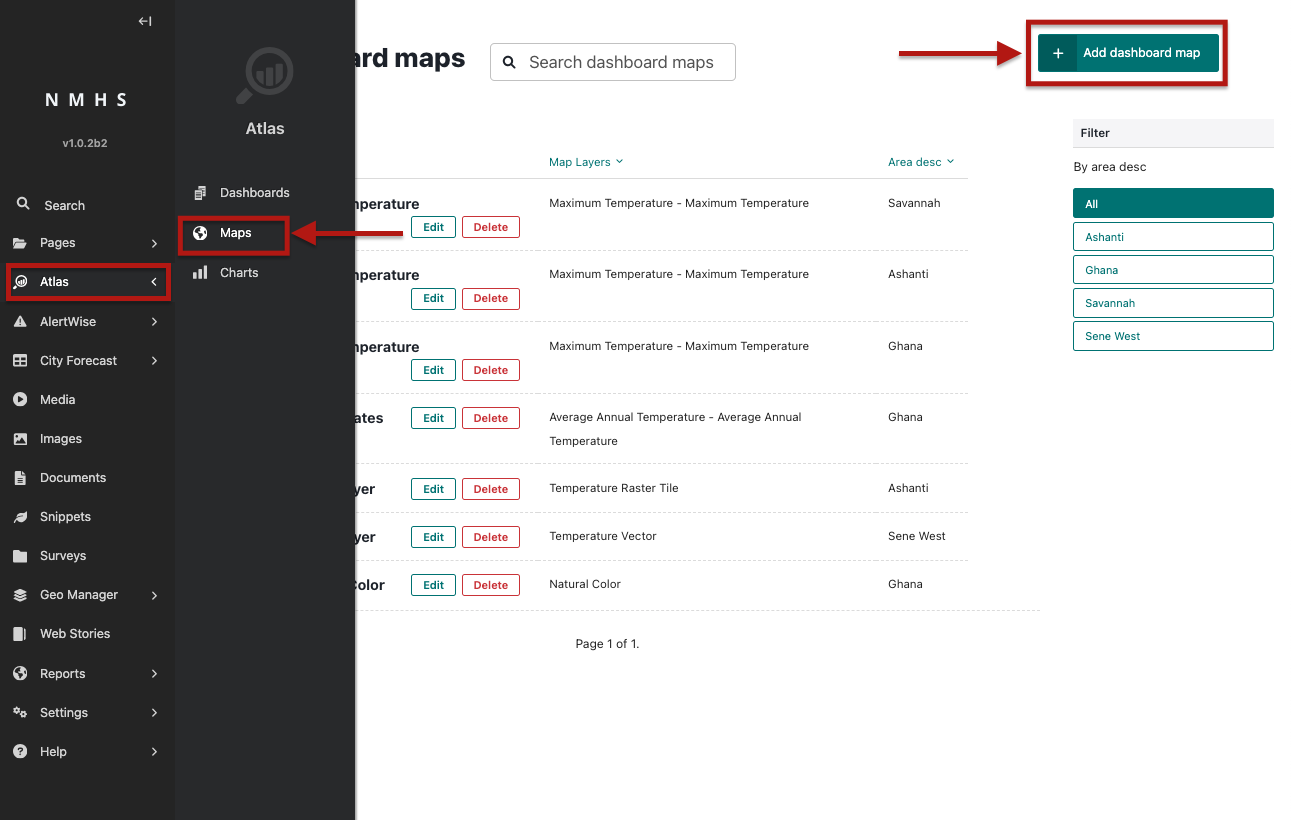
In Admin Menu, go to Atlas → Maps → Add Map.
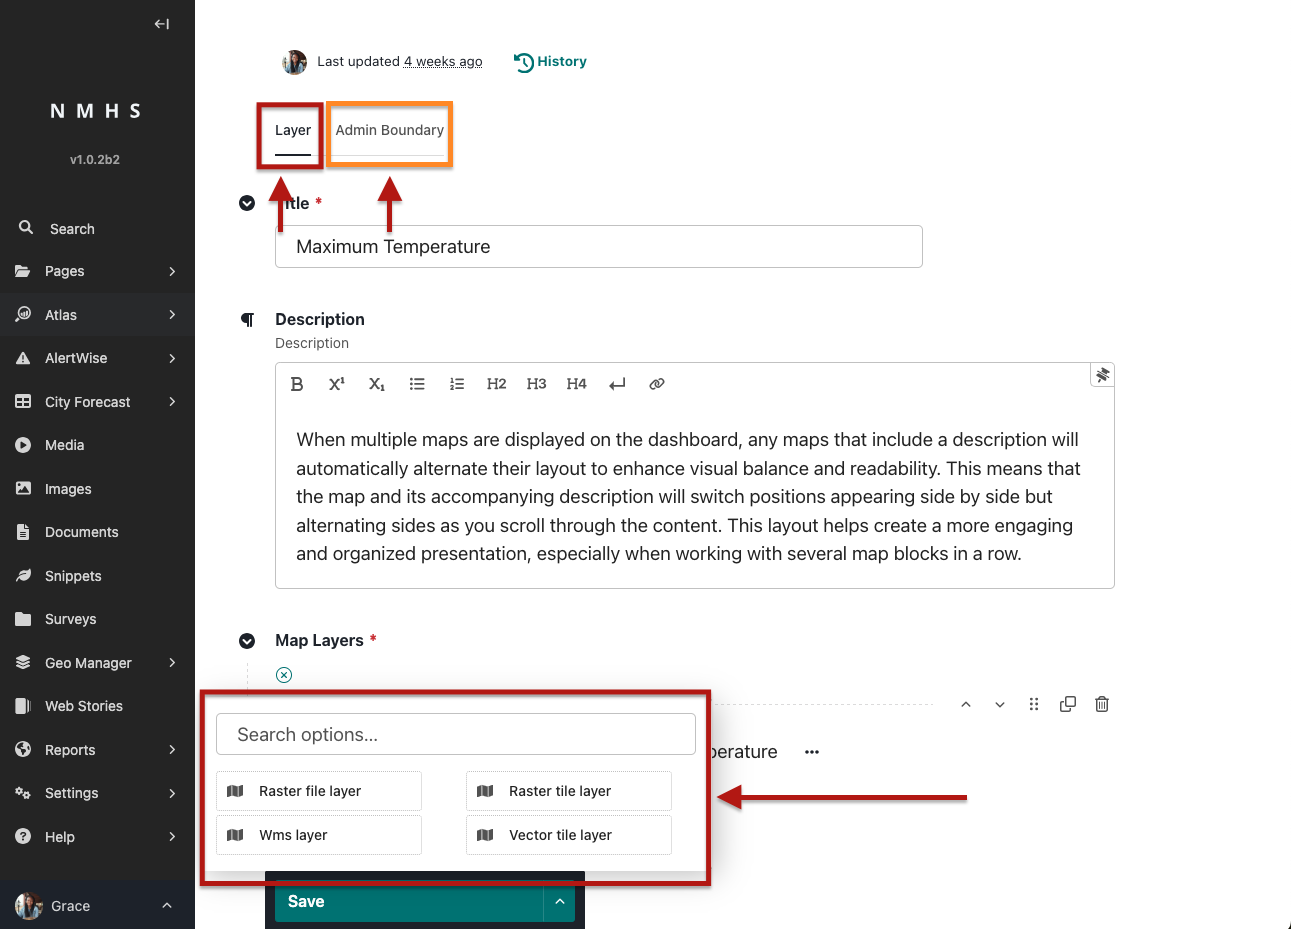
Fill in the following:
Title – A short name for the map.
Optional Description – Explains what the map shows.
Dataset – Choose from datasets created in GeoManager.
Layer Type – One per snippet (Raster File Layer, Raster Tile Layer, WMS Layer, or Vector Tile Layer).
Legend – Already defined in GeoManager when creating the dataset (not in the snippet).
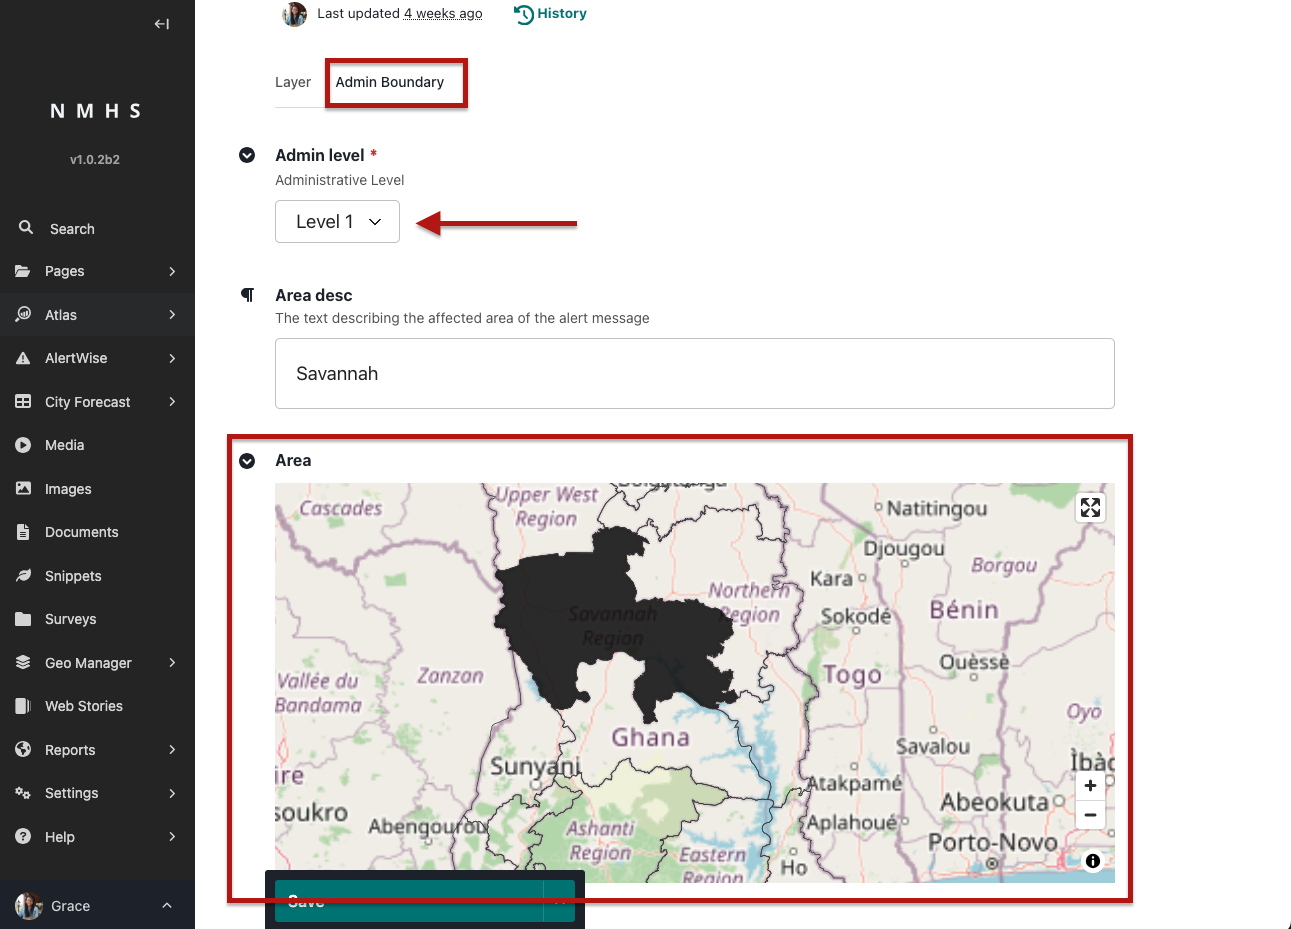
Admin Area – Select an admin level and then click on the map to generate the area description.
Save the snippet.
Note: Each snippet can only contain one layer.
How to Create a Chart Snippet
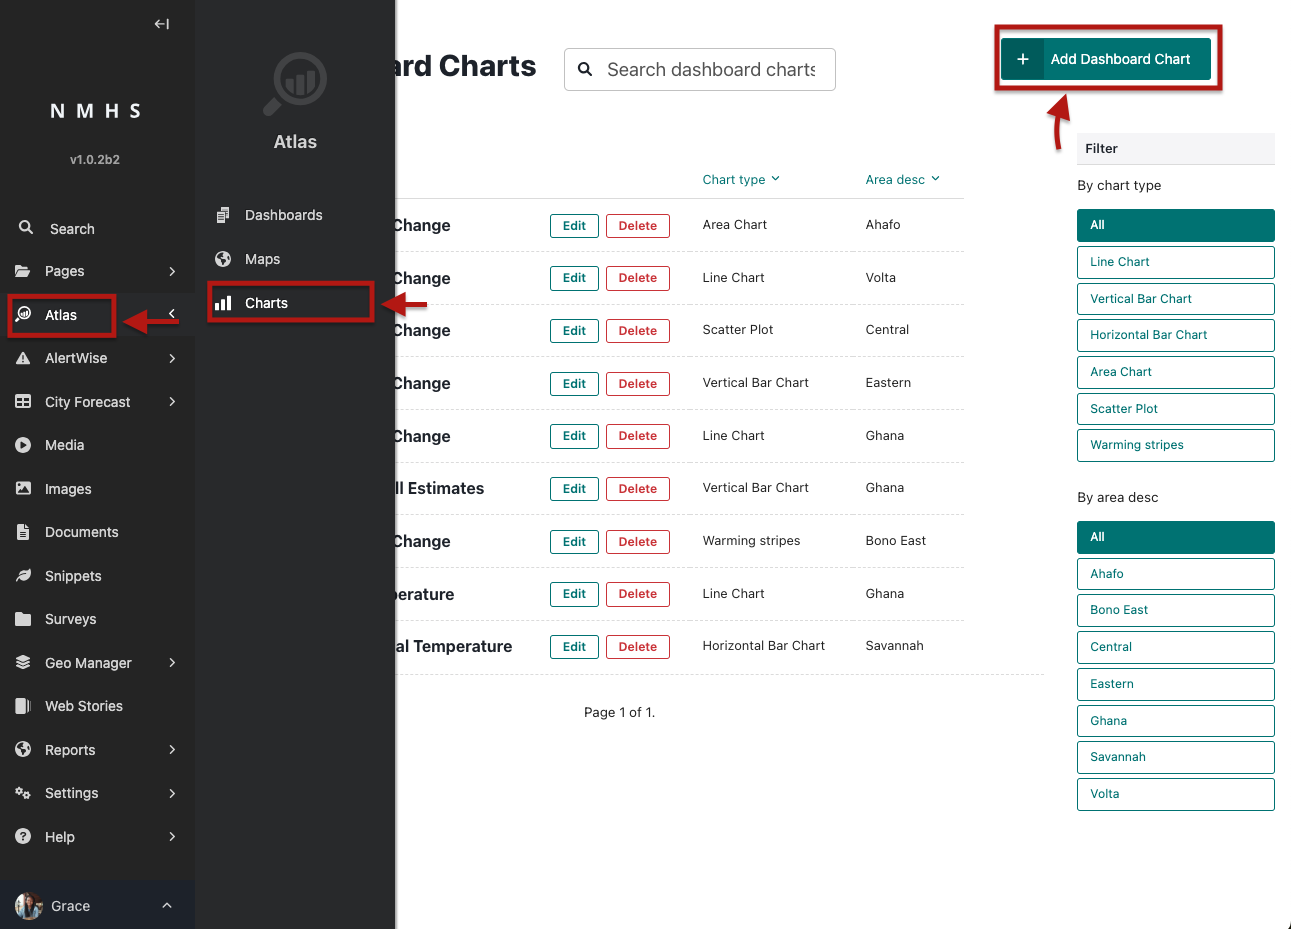
In Wagtail Admin, go to Snippets → Dashboard Charts → Add Chart.
Fill in the following:
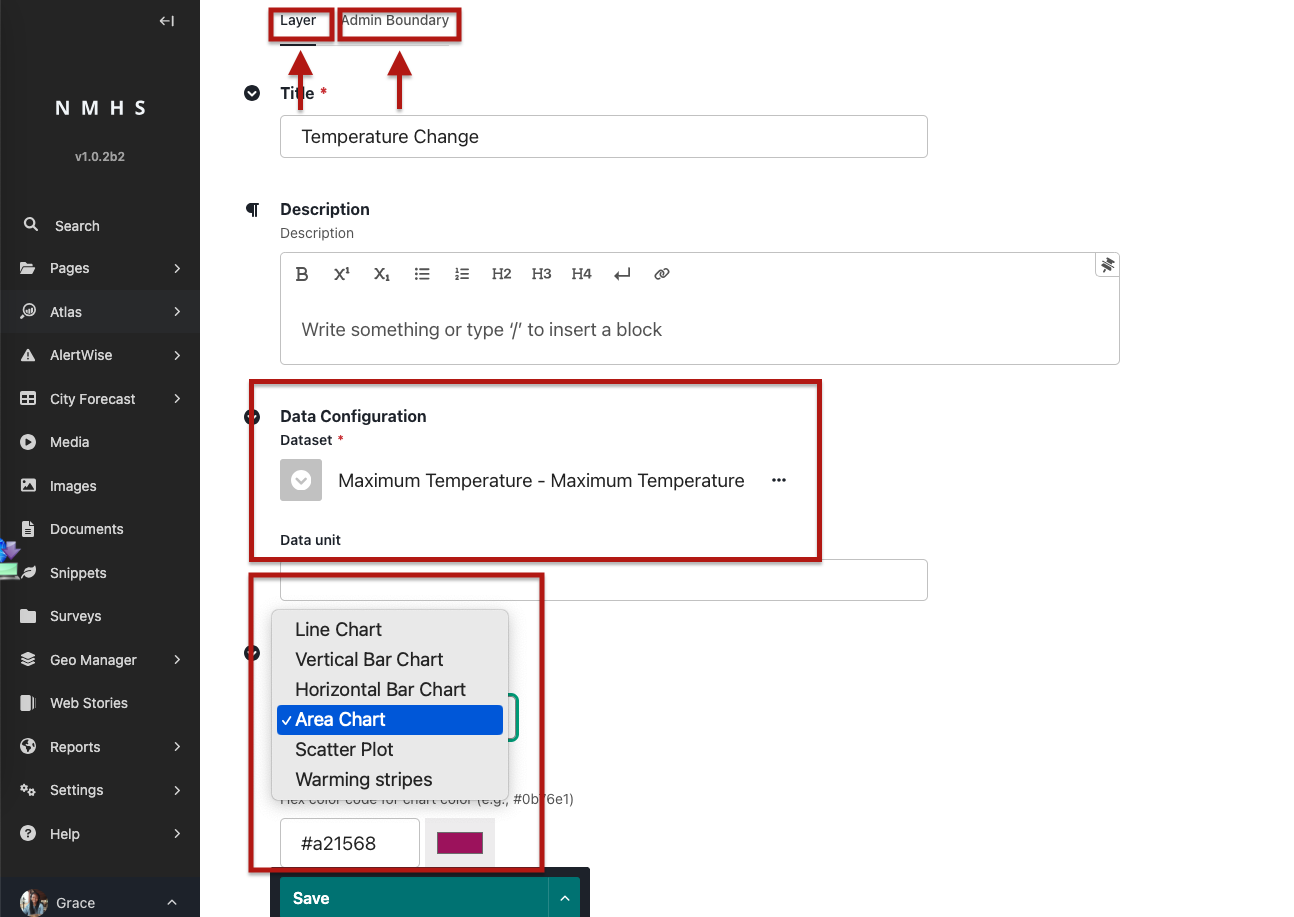
Title – A short name for the chart.
Optional Description – A short explanation of the chart.
Dataset – Choose the dataset that will power the chart.
Chart Type - available options are bar graph, column graph, line chart, area chart and heatmap
Chart Colour - The color that will be applied to the graph when styling the data.
Admin Area – Select an admin level and then click on the map to generate the area description.
Save the snippet.
Block Layout Rules
Blocks can be arranged in any order.
When two Map blocks or two Chart blocks appear consecutively and each has a description, the text/title alternates sides automatically:
Example: First block → text on the left, map/chart on the right.
Next block → text on the right, map/chart on the left.
This ensures dashboards remain visually balanced and easy to read.
✅ With this setup, you can create rich dashboards combining text, images, tables, maps, and charts—all styled for clarity and interactivity.