Atlas | Interactive Dashboards
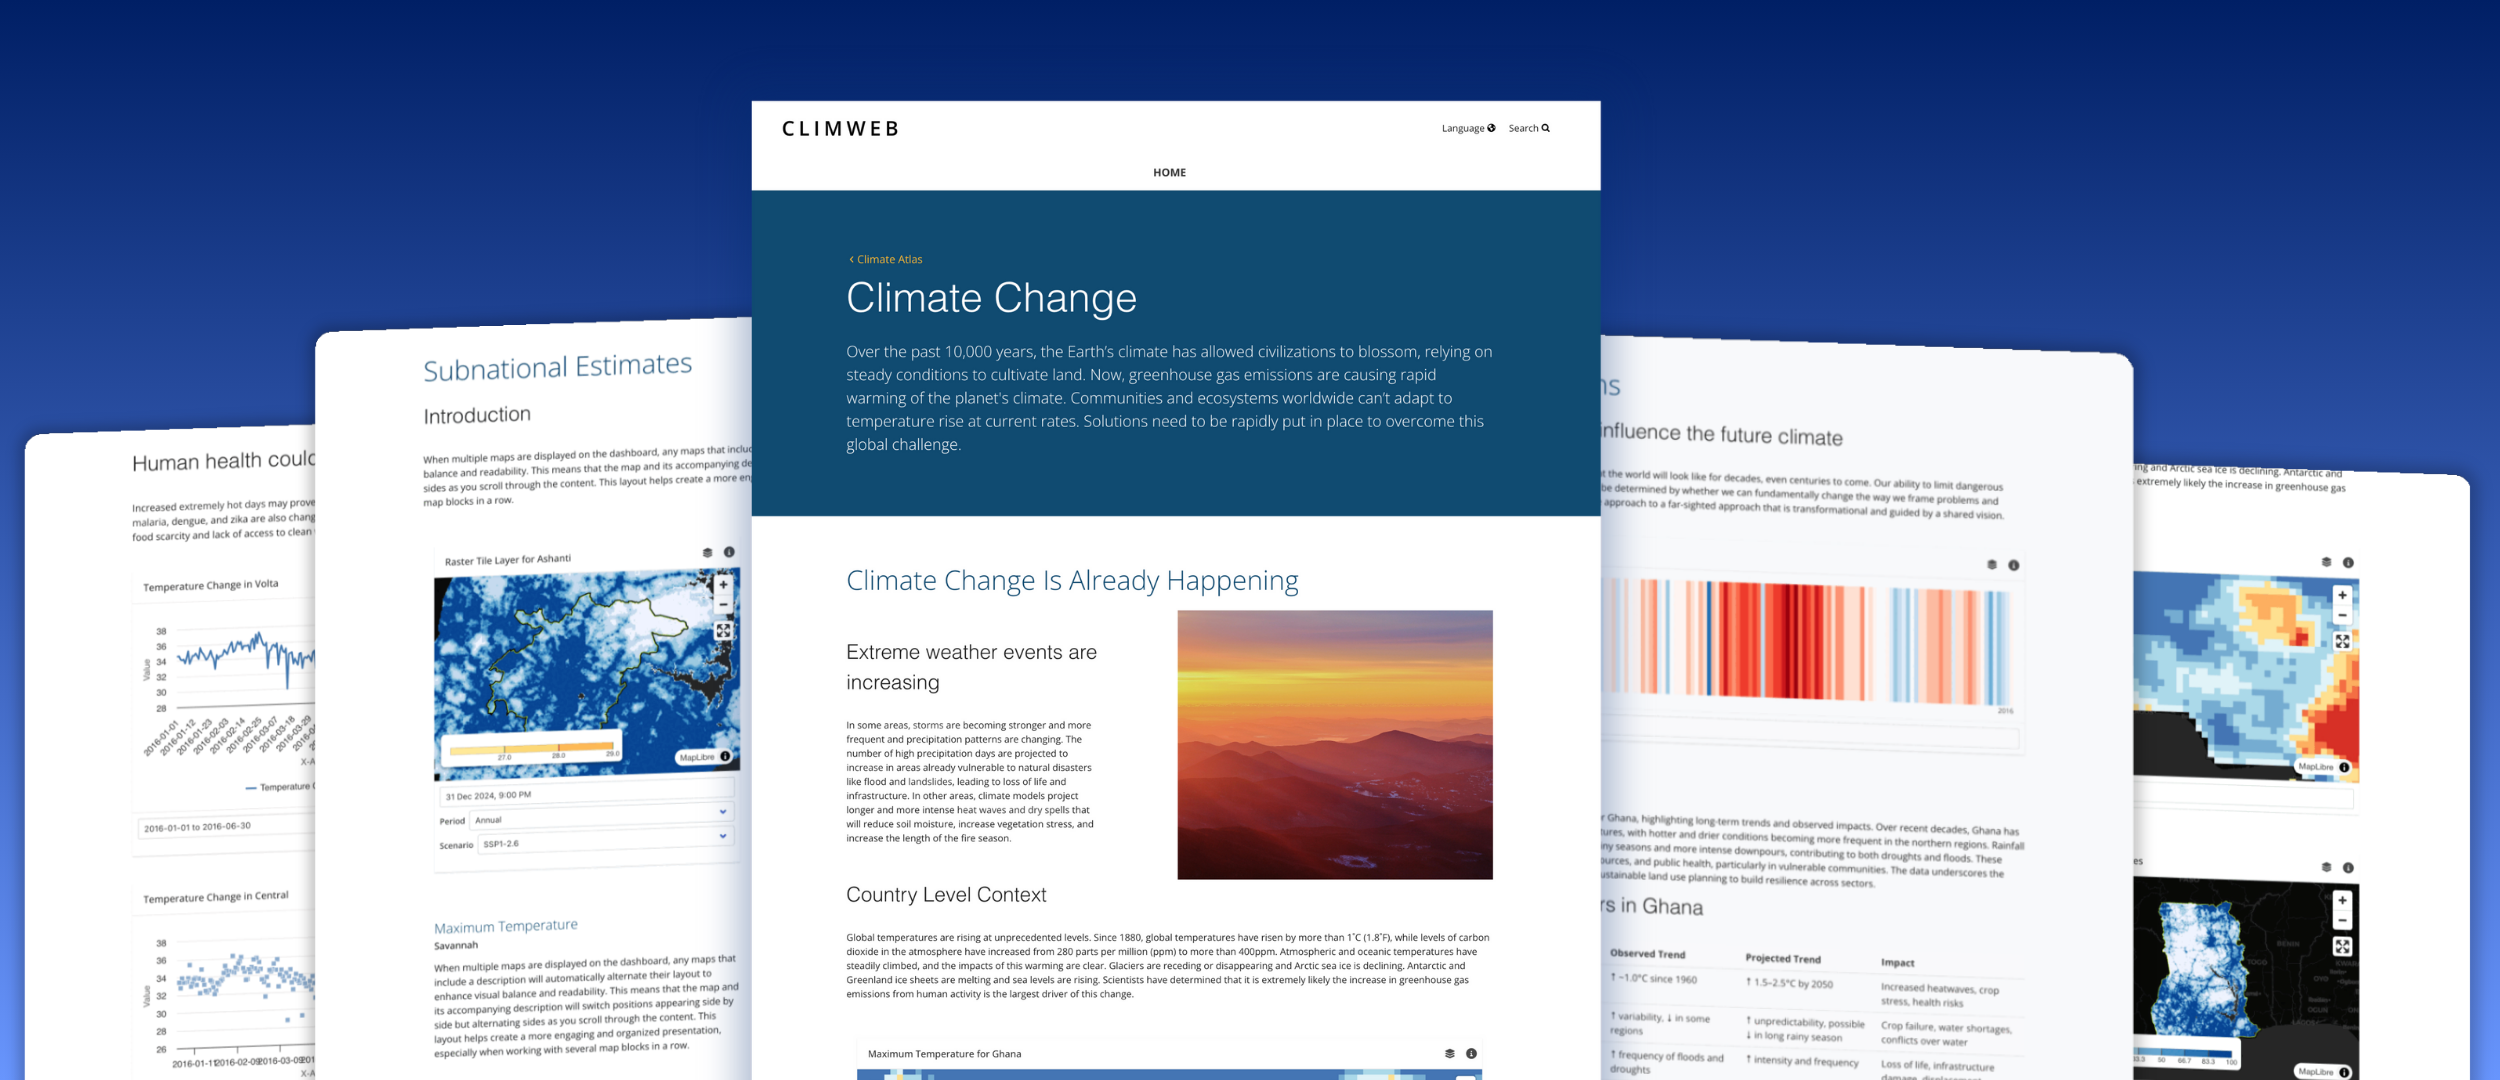
The Atlas is a component of climweb that enables modular, reusable, and CMS-editable dashboards that bring together maps, charts, warming stripes, and narrative content for effective climate data storytelling. This component is linked to the geomanager/mapviewer component within climweb allowing linkage with already created datasets/layers and boundary data. It features:
Interactive dashboards built using reusable blocks for maps, charts, text, images, and other components — enabling flexible and modular page layouts
Dynamic maps supporting raster, vector tile, and WMS layers with custom symbology and legend options
Warming stripes for a visual summary of long-term temperature trends
Customizable charts for time-series and comparative analysis in bar, column, line or scatter plots
A user-friendly CMS that allows teams to manage and update dashboard content independently
Analysis at different admin levels